Chicago Rent Prices
Taking data on Chicago rent prices by neighborhood and designing this information into a digestible and usable format.
Role
User Designer
Team
Melissa Vozar
Timeline
January - March 2026
Tools
Figma
HTML
Airtable
Over 10 weeks, I took raw data on Chicago rent prices by neighborhood and turned it into meaningful information through HTML, user flows, and site maps to develop wireframes for a potential product.
Overview
In Northwestern's Information Architecture course, I developed practical skills for organizing, structuring, and presenting data to create meaningful user experiences. Throughout the course, I gained hands-on experience transforming raw data into useful information through semantic HTML, dynamic data visualization, and front-end manipulation techniques. I worked with classification systems, navigation patterns, and taxonomy strategies to design digital products that help users effectively locate and act upon information.
Background
For this course, I was tasked with finding a source of content of my choice and capturing it in a manipulative environment to create new value propositions. The data set that I decided on for this project was Chicago rent prices by neighborhood.
Data Set
I took one row of data from my dataset and marked up each element with the column name of the field in Airtable. After I created the example record using just column names, I used HTML tags to translate up to two of my other records with real HTML markup, chosen as I thought was appropriate to the hierarchy and grouping.
HTML
I developed a site map and flow diagram to help illustrate my process and design.
Site Map & Flow Diagram
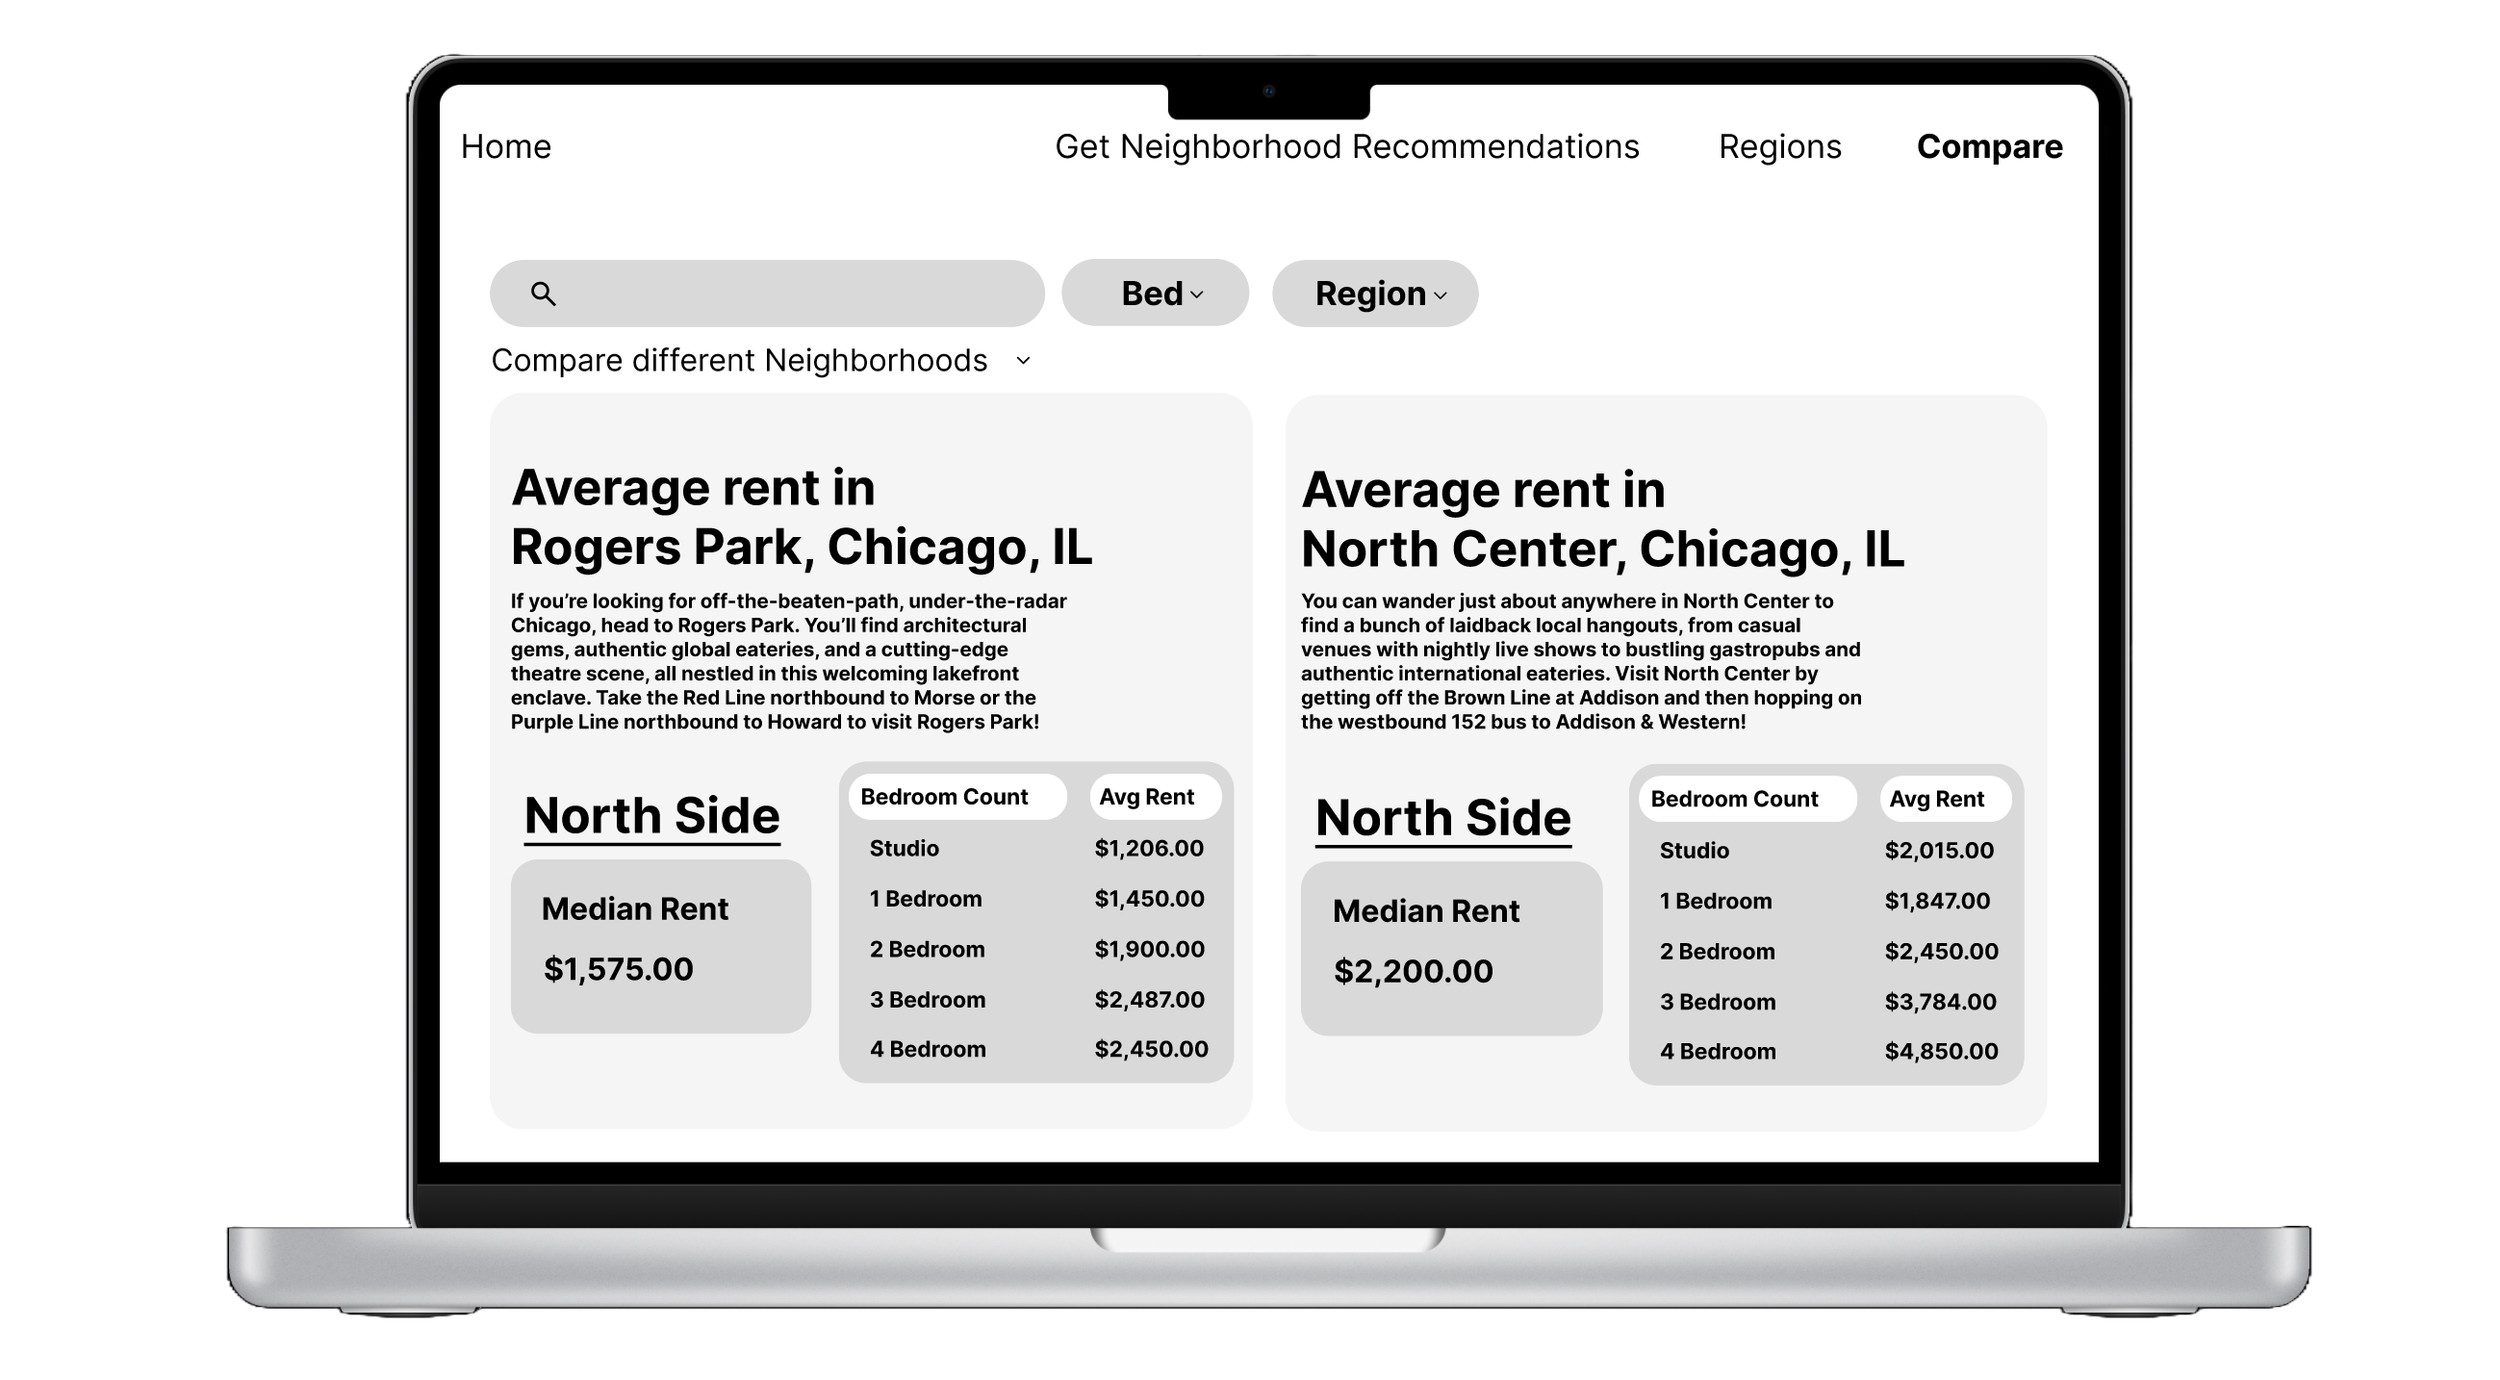
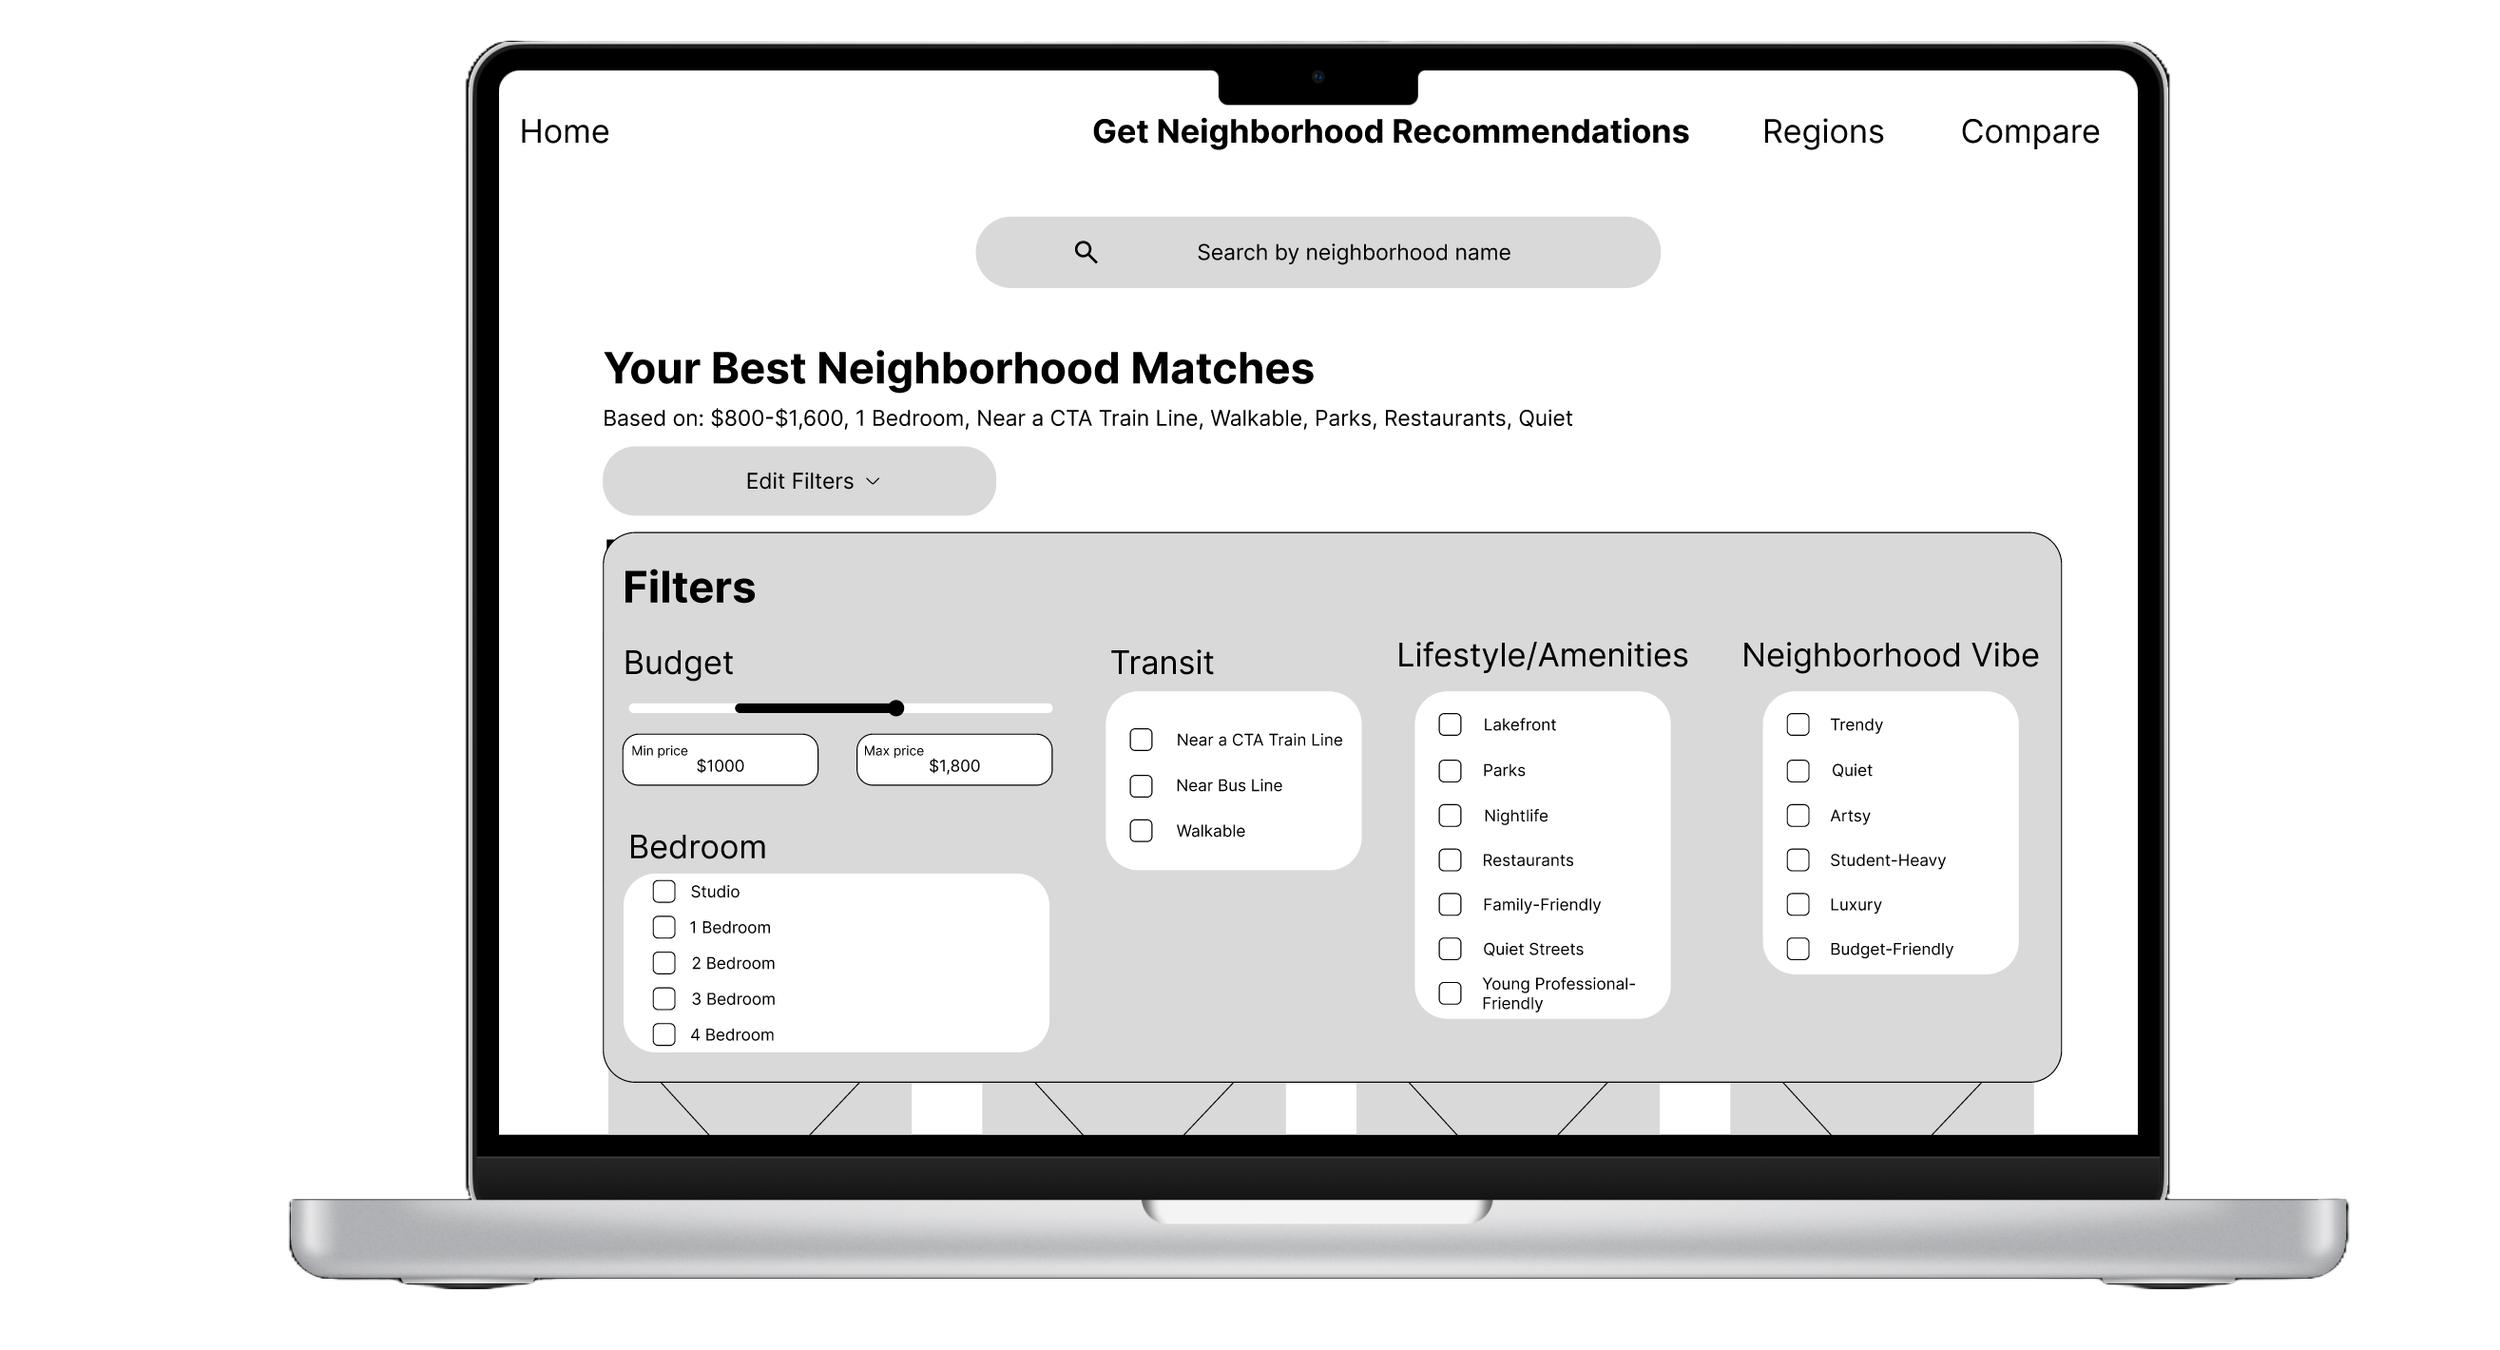
I designed a detailed, black-and-white wireframe with real content, displaying how the content and navigation appear to a user to help them contextualize the records.
Wireframes
Check out more of my work!